Chicago's Bus Friendly Streets: Ward Report Cards
17 Bus Routes with 17,315 total weekday rides
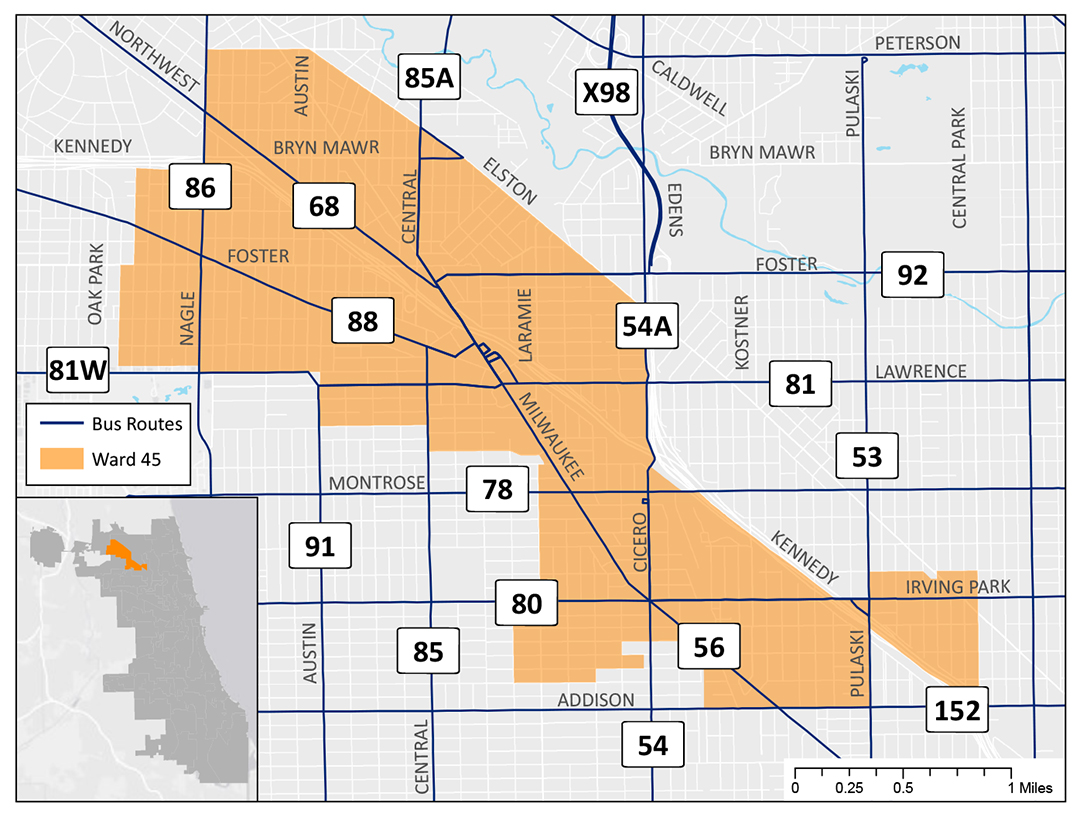
45th WARD
17 Bus Routes with 17,315 total weekday rides
8.2%
0%
20%
The three routes with the most bunching in the ward.
The three routes with the highest typical wait time in the ward.
The three routes with the slowest average speeds within the ward.
The three routes with the most boardings within the ward.
Prioritize Buses on City Streets
Every day, Chicagoans take 826,322 rides on our city’s buses, connecting them to jobs, schools, healthcare, and other services while taking up far less space than cars. Too often these buses are getting stuck in traffic and service is slow and unreliable. Ways to improve bus service now:
Add more bus lanes with effective and equitable enforcement
Speed up boarding with tap and go payment at all doors
Give buses priority at traffic lights
Buses move many more people than cars yet take up a fraction of the space on city streets. Without more investment in bus service, Chicago risks more people abandoning transit for transportation options that are more expensive and less efficient, healthy, and green. However, upgrading bus service is not a priority for the mayor and city council. Let’s ask our elected officials to prioritize bus service on city streets to create a world class network with fast and reliable service that serves ALL Chicagoans!
Interested in this methodology? Want to learn more about the campaign? Go to activetrans.org/busreportcards or contact Julia Gerasimenko at [email protected] or 312-216-0489.
#backonthebus